|
|
Order by Related
- New Release
- Rate
Results in Title For debugger
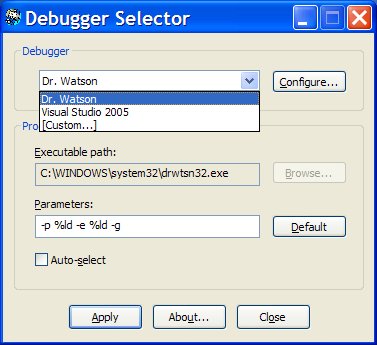 | Select the best tool to process an unhandled application exception without modifying the Windows registry. .. |
|
 | Debugger for PHP. Expert Debugger uses the DBG PHP Debugger and allow to debug scripts via network or on local computer. You can run scripts in step-by-step mode and to trace values of any variables and script output. ..
|
|
 | Team Remote Debugger is a new revolutionary distributed application development tool, which allows you and your team to trace any number of code units of any kind ( ASP, MTS, T-SQL, COM+, ActiveX Exe, DLL, COM, Thread, CFML ), written in any language ( ASP, VB, VC++, Delphi, T-SQL, VJ, CFML ) residing on multiple shared and dedicated servers at the same time, without ever attaching to process!
For more information and to test-drive Team Remote Debugger check out:
http://www.RemoteDebugger.com/team_remote_debugger.asp .. |
|
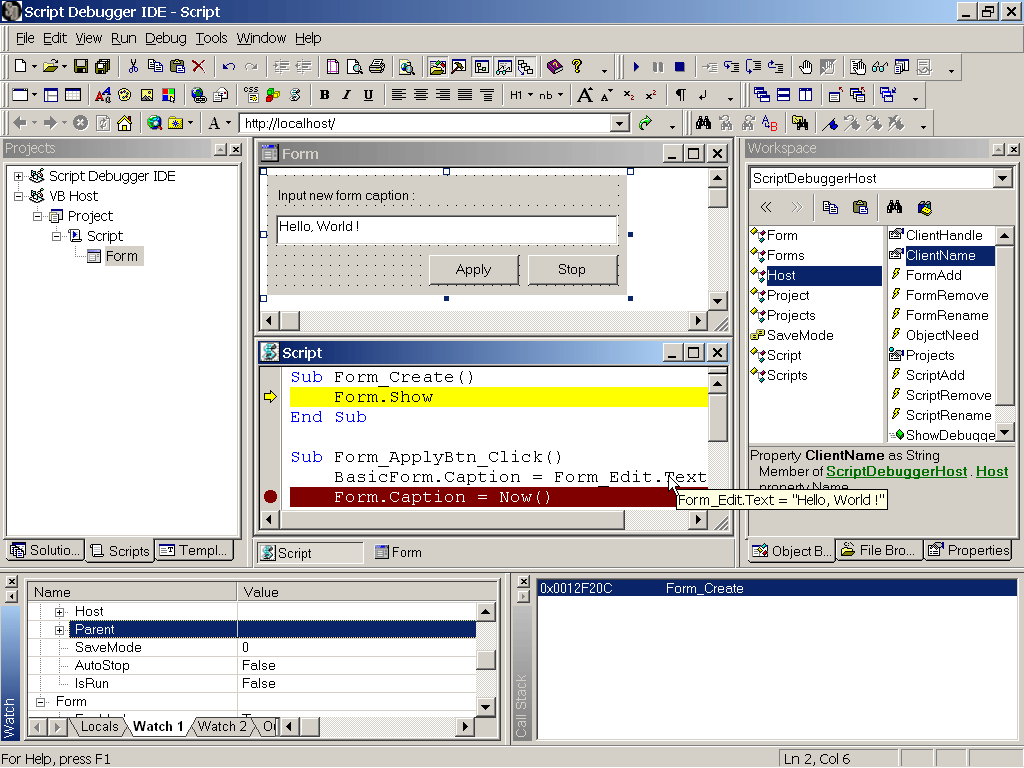 | Script Debugger IDE is full-featured client and server ActiveX Scripting debugger. It provides developers with a robust set of tools for developing scripts and Web applications. With Script Debugger IDE, developers can set breakpoints on both client- and server-side scripts, step through code, add "watch" variables, investigate the call stack, and debug remote Web servers. IDE has various power tools e.g. Object Browser to examine and discover objects, WMI Wizard to create WMI-based scripts, etc. Also Script Debugger IDE provides all functionality of Macros IDE with ability to debug macros. ..
|
|
 | SplineTech JavaScript HTML Debugger is a unique award-winning javascript debugging tool that enables you to easily edit and debug JavaScript and VBScript inside HTML pages. Client-Side JavaScript, JScript and VBScript debugging languages are fully supported for simple and complex HTML and DHTML debugging scenarios.Now Featuring dockable floating windows, and an intagrated interactive step by step javascript debugging guide. Latest feature added - Local variable Watch tree. .. |
|
 | Regardless of whether you are maintaining a complex corporate web site or running a personal blog, the HTTP Debugger Pro will assist you in locating the web site errors and identifying slow performing web pages. ..
|
|
 | SplineTech JavaScript Debugger is the independent standalone JavaScript Debugger that enables you to easily edit and debug JavaScript and client-side VBScript inside HTML, DHTML and AJAX pages. .. |
|
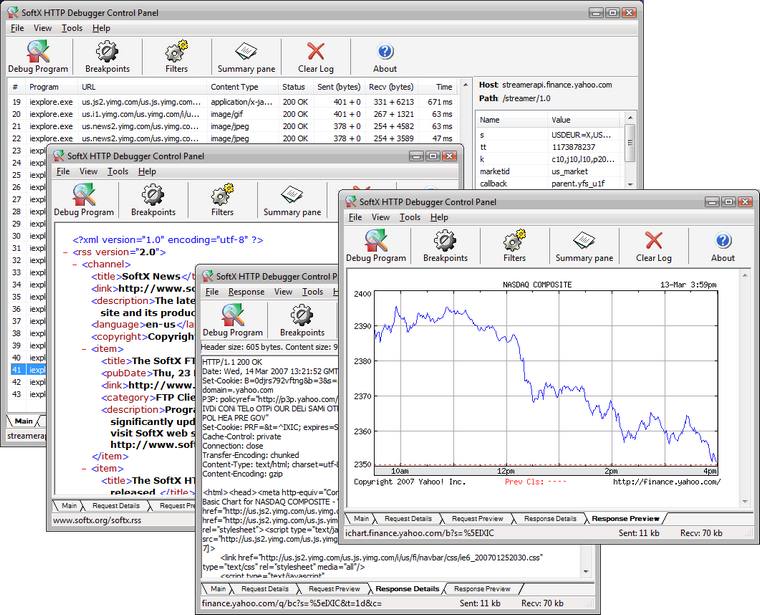 | SoftX HTTP Debugger is a full-scale tool for developers for viewing and analyzing all outgoing and incoming HTTP protocol traffic between a web browser, or any other Internet related program, and the Internet.
Each HTTP request and/or response can be examined to see the HTTP header parameter values, cookies, query strings and error codes etc. All captured network traffic can be saved either in a RAW network format or in a decoded (how browsers see it) format.
HTTP Debugger works with all today's alternative browsers and their plugins, as well as with your own software. You can even monitor and debug ICQ, MSN, Yahoo Messenger and other popular Internet programs.
* Monitor and debug all outgoing HTTP requests from a browser (or any other Internet related program) and the corresponding responses from a server.
* See the full HTTP header and HTTP content data of both: HTTP requests and responses.
* Catch when the browser performs automatic redirects.
* Capture requests from all of the installed plugins (Flash, ActiveX, etc,) in addition to requests sent by a browser directly.
* View all the captured images, HTML or XML code, etc in the built-in web control.
* Simultaneously analyze the same page in all popular browsers.
* Measure the size and downloading time of your web pages to optimize the performance of your web site.
* The gzip and chunked encodings will be automatically processed by the program.
* View information supplied by each web browser or any program when you visit a site.
* Analyze how other sites work and how they implement certain features.
* Learn about how HTTP works (useful for when programming and web designing).
Supports Internet Explorer 7 Protected Mode in Windows Vista. .. |
|
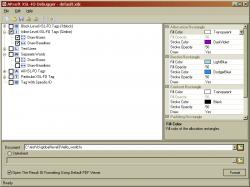 | XSL-FO Debugger is the software for visual debugging of XSL stylesheets. It is based on Altsoft Xml2PDF formatting engine. In short, XSL-FO Debugger takes an XSL-FO file or a pair of XML and XSLT files as an input, follows XSL-FO formatting instructions and generates a PDF document as an output. The resulting PDF file may contain layers for displaying boxes (these are content box, allocation box, border box and padding box), baseline tables and breaks for the groups of FO objects and particular FO objects as well.
The XSL-FO specification can be very intricate when you are trying to find out what's wrong with this or that FO document. In fact, it is often not so easy to answer many tricky questions that arise when you create a document with a complex structure and thousands of objects. Why are these nested blocks not present on where they should be? What happened to that line? Where on earth is the header? Is it my error or I should send a letter to the producer of my formatter?
Xsl-Fo Debugger helps you to avoid spending precious time on re-calculating object parameters, re-reading specification and revising your code. It introduces the visual representation of all basic document areas, baseline tables and breaks generated by the formatter so that you can find irritating shortcomings as fast as possible.
What is even more convenient you may select the areas or baselines to be displayed. You may also change the color or opacity of displayed objects as it is described in the following sections. In addition, a separate PDF layer is created for each class of debugged objects, which makes your PDF document interactive and allows turning on/off the particular layers. This feature makes Xsl-Fo Debugger much more applicable and flexible tool. And here the time of your own fantasy and creativity begins! .. |
|
 | Award-winning VBS Debugging Tool: Set Breakpoints, Watch Variables, Edit and Debug your VBS code. Vbscript and Javascript Debugging Languages Fully Supported. .. |
|
Results in Keywords For debugger
| Team Remote Debugger is a new revolutionary distributed application development tool, which allows you and your team to trace any number of code units of any kind ( ASP, MTS, T-SQL, COM+, ActiveX Exe, DLL, COM, Thread, CFML ), written in any language ( ASP, VB, VC++, Delphi, T-SQL, VJ, CFML ) residing on multiple shared and dedicated servers at the same time, without ever attaching to process!
For more information and to test-drive Team Remote Debugger check out:
http://www.RemoteDebugger.com/team_remote_debugger.asp.. |
|
| SplineTech JavaScript Debugger is the independent standalone JavaScript Debugger that enables you to easily edit and debug JavaScript and client-side VBScript inside HTML, DHTML and AJAX pages...
|
|
| Script Debugger IDE is full-featured client and server ActiveX Scripting debugger. It provides developers with a robust set of tools for developing scripts and Web applications. With Script Debugger IDE, developers can set breakpoints on both client- and server-side scripts, step through code, add "watch" variables, investigate the call stack, and debug remote Web servers. IDE has various power tools e.g. Object Browser to examine and discover objects, WMI Wizard to create WMI-based scripts, etc. Also Script Debugger IDE provides all functionality of Macros IDE with ability to debug macros... |
|
| Debugger for PHP. Expert Debugger uses the DBG PHP Debugger and allow to debug scripts via network or on local computer. You can run scripts in step-by-step mode and to trace values of any variables and script output...
|
|
 | A very powerful, versatile, and customizable Win32 user mode debugger/disassembler. PEBrowse Interactive is not a source code debugger, but operates at the Intel x86 instruction level and therefore at the lowest level where your program executes... |
|
 | SplineTech VBS Debugger PRO is an award-winning VBS debug tool that enables you to easily edit and debug VBS files, debug VBS scripts and JS scripts. Native support for JavaScript, Jscript, VBScript and Windows Scripting Host (wscript)...
|
|
| XSL-FO Debugger is the software for visual debugging of XSL stylesheets. It is based on Altsoft Xml2PDF formatting engine. In short, XSL-FO Debugger takes an XSL-FO file or a pair of XML and XSLT files as an input, follows XSL-FO formatting instructions and generates a PDF document as an output. The resulting PDF file may contain layers for displaying boxes (these are content box, allocation box, border box and padding box), baseline tables and breaks for the groups of FO objects and particular FO objects as well.
The XSL-FO specification can be very intricate when you are trying to find out what's wrong with this or that FO document. In fact, it is often not so easy to answer many tricky questions that arise when you create a document with a complex structure and thousands of objects. Why are these nested blocks not present on where they should be? What happened to that line? Where on earth is the header? Is it my error or I should send a letter to the producer of my formatter?
Xsl-Fo Debugger helps you to avoid spending precious time on re-calculating object parameters, re-reading specification and revising your code. It introduces the visual representation of all basic document areas, baseline tables and breaks generated by the formatter so that you can find irritating shortcomings as fast as possible.
What is even more convenient you may select the areas or baselines to be displayed. You may also change the color or opacity of displayed objects as it is described in the following sections. In addition, a separate PDF layer is created for each class of debugged objects, which makes your PDF document interactive and allows turning on/off the particular layers. This feature makes Xsl-Fo Debugger much more applicable and flexible tool. And here the time of your own fantasy and creativity begins!.. |
|
 | Team Remote ASP Debugger is an award-winning ASP debugging tool that enables your team to easily edit and debug ASP code remotely and locally, directly on your production server. JavaScript debugging and VBScript debugging is fully supported for simple and complex local, remote and team remote debugging scenarios.
Now Featuring dockable floating windows, and an intagrated interactive step by step ASP debugging guide.
Team Remote ASP Debugger enables you to:
Debug VBScript error in ASP code,
Debug JavaScript (jscript) error in ASP code,
Expression Evaluation,
Set Breakpoints in ASP,
Step in / out / over,
Variable Watch,
Advanced "GET" and "POST" form debugging
and more.. |
|
| Select the best tool to process an unhandled application exception without modifying the Windows registry... |
|
| SplineTech JavaScript HTML Debugger is a unique award-winning javascript debugging tool that enables you to easily edit and debug JavaScript and VBScript inside HTML pages. Client-Side JavaScript, JScript and VBScript debugging languages are fully supported for simple and complex HTML and DHTML debugging scenarios.Now Featuring dockable floating windows, and an intagrated interactive step by step javascript debugging guide. Latest feature added - Local variable Watch tree... |
|
Results in Description For debugger
| Team Remote Debugger is a new revolutionary distributed application development tool, which allows you and your team to trace any number of code units of any kind ( ASP, MTS, T-SQL, COM+, ActiveX Exe, DLL, COM, Thread, CFML ), written in any language ( ASP, VB, VC++, Delphi, T-SQL, VJ, CFML ) residing on multiple shared and dedicated servers at the same time, without ever attaching to process!
For more information and to test-drive Team Remote Debugger check out:
http://www.RemoteDebugger.com/team_remote_debugger.asp.. |
|
 | Visual DuxDebugger is a debugger disassembler for Windows 64 bits...
|
|
 | ScriptDebugger is a small and FREE debugger tool that you can use for help when debugging vb script... |
|
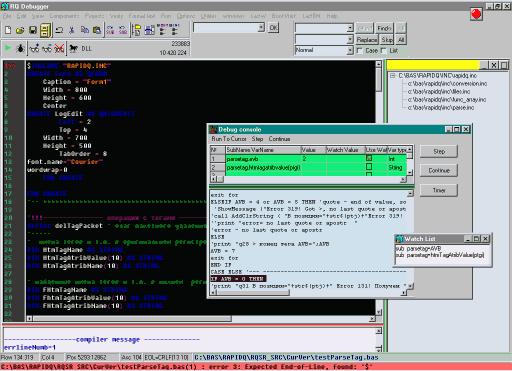 | RQ Debugger IDE is programmer editor for Rapid-Q Basic and FreeBasic programming languages
Main features:
- multiwindow
You can open 32 files and switch to one using "Windows" menu item.
You can switch to last window (with saving cursor's position) using "LastW" menu item.
- named bookmarks
You can set 32 bookmarks in every window (opened file)
You can "Add", "Delete", "Set", "Sort" bookmarks.
You can switch to last bookmark using "LastBM" menu item.
- projects
You can save list of windows and bookmarks as Project.
When RQ Debugger IDE is running, it loads all Windows (and other settings) from last project.
It automatically open last Window and set cursor to saved position.
- step-by-step debugger for Rapid-Q basic
execute while value not equal..
execute to cursor
step-by-step execution
- objects treeView
- include files treeView
- syntax hilighting
- FreeBasic dll compilation
- sub list
- fileManager..
|
|
| XSL-FO Debugger is the software for visual debugging of XSL stylesheets. It is based on Altsoft Xml2PDF formatting engine. In short, XSL-FO Debugger takes an XSL-FO file or a pair of XML and XSLT files as an input, follows XSL-FO formatting instructions and generates a PDF document as an output. The resulting PDF file may contain layers for displaying boxes (these are content box, allocation box, border box and padding box), baseline tables and breaks for the groups of FO objects and particular FO objects as well.
The XSL-FO specification can be very intricate when you are trying to find out what's wrong with this or that FO document. In fact, it is often not so easy to answer many tricky questions that arise when you create a document with a complex structure and thousands of objects. Why are these nested blocks not present on where they should be? What happened to that line? Where on earth is the header? Is it my error or I should send a letter to the producer of my formatter?
Xsl-Fo Debugger helps you to avoid spending precious time on re-calculating object parameters, re-reading specification and revising your code. It introduces the visual representation of all basic document areas, baseline tables and breaks generated by the formatter so that you can find irritating shortcomings as fast as possible.
What is even more convenient you may select the areas or baselines to be displayed. You may also change the color or opacity of displayed objects as it is described in the following sections. In addition, a separate PDF layer is created for each class of debugged objects, which makes your PDF document interactive and allows turning on/off the particular layers. This feature makes Xsl-Fo Debugger much more applicable and flexible tool. And here the time of your own fantasy and creativity begins!.. |
|
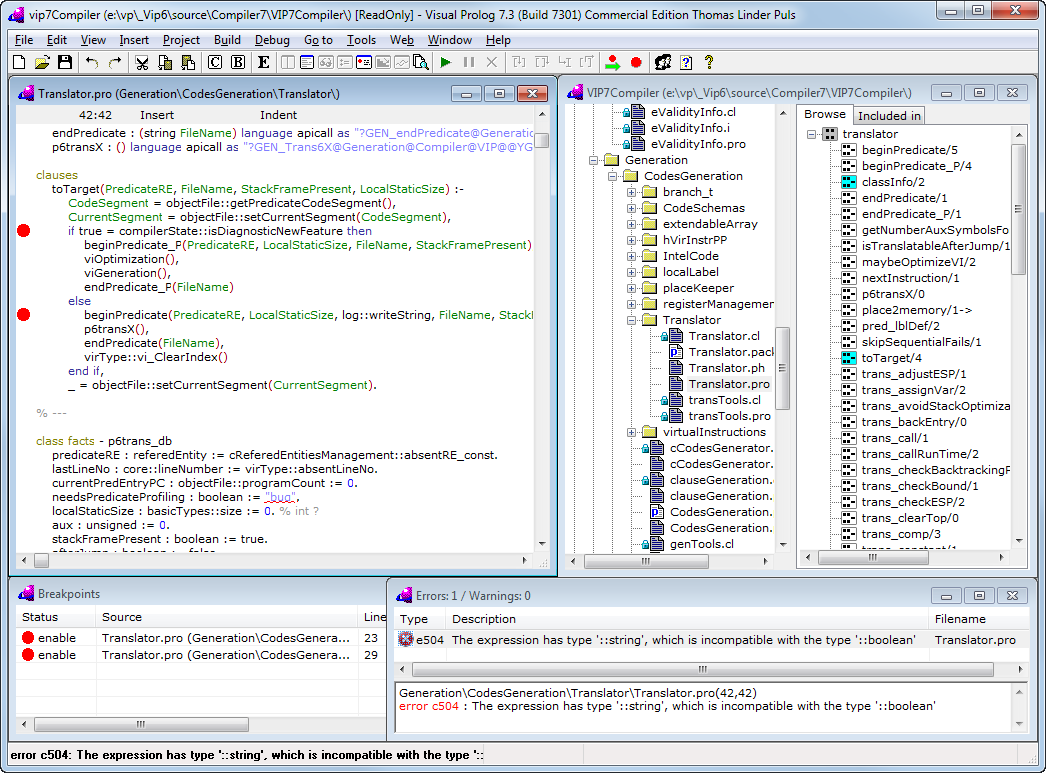 | Visual Prolog 7.3, Build 7303 Personal Edition (PE): Programming environment: compiler, IDE, linker, debugger...
|
|
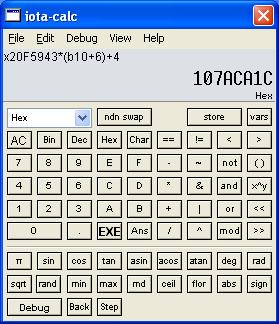 | An all purpose scientific calculator, designed with programmers in mind.- Supports a rich expression format, which is in most cases identical to what you would type in your programming language. - Built-in debugger.- Many more features... |
|
| Expert System Creator helps you easily build expert systems in one of the following forms: decision frame (set of rules), decision tree and decision table. Expert System Creator suite is composed of: - Decision Frame Designer - Decision Table Designer - Decision Tree Designer - Code Generator Module and Dictionary Manager - Version Manager and Explorer. Decision Frame Designer is a rule-based expert system designer that allows you to design, debug, profile and generate code for your system. Decision Frame Debugger is a powerful debugger offering you the possibility to test your system against the expert system shells: CLIPS and JESS. Decision Tree Designer represents business logic in the convenient form of a decision tree. Using Decision Tree Debugger and Tracing module let you test and debug the behavior of the decision tree after you integrate it in your application. Decision Table Designer represents business logic in the compact and understandable form of a decision table. A decision table is suitable for the analysis of completion and correctness, which is supported by the Table Analyzer module. Both Decision Table and Decision Tree Designer use Code Generator and Dictionary Manager modules to easily integrate your decision tables/trees in external C++/Java applications. Version Manager module and Version Explorer graphical tool are integrated in all three designers enabling you to manage your individual and team projects easier than before... |
|
| Team Remote ASP Debugger is an award-winning ASP debugging tool that enables your team to easily edit and debug ASP code remotely and locally, directly on your production server. JavaScript debugging and VBScript debugging is fully supported for simple and complex local, remote and team remote debugging scenarios.
Now Featuring dockable floating windows, and an intagrated interactive step by step ASP debugging guide.
Team Remote ASP Debugger enables you to:
Debug VBScript error in ASP code,
Debug JavaScript (jscript) error in ASP code,
Expression Evaluation,
Set Breakpoints in ASP,
Step in / out / over,
Variable Watch,
Advanced "GET" and "POST" form debugging
and more.. |
|
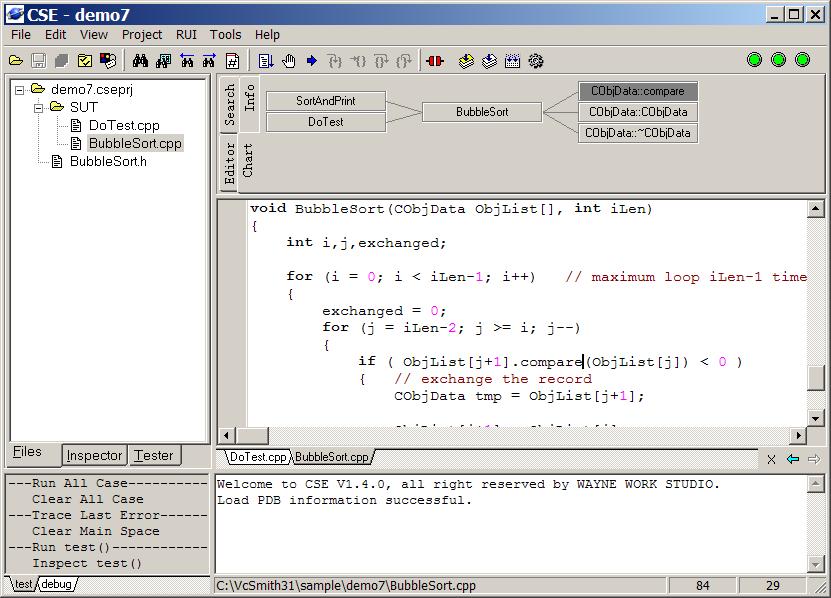 | VcSmith is the combination of Source Insight, Visual Assist, CppUnit, and VC debugger, as well as the integration of advantages of multiple tools. it works with Visual C/C++.. |
|
Results in Tags For debugger
| Team Remote Debugger is a new revolutionary distributed application development tool, which allows you and your team to trace any number of code units of any kind ( ASP, MTS, T-SQL, COM+, ActiveX Exe, DLL, COM, Thread, CFML ), written in any language ( ASP, VB, VC++, Delphi, T-SQL, VJ, CFML ) residing on multiple shared and dedicated servers at the same time, without ever attaching to process!
For more information and to test-drive Team Remote Debugger check out:
http://www.RemoteDebugger.com/team_remote_debugger.asp.. |
|
| Debugger for PHP. Expert Debugger uses the DBG PHP Debugger and allow to debug scripts via network or on local computer. You can run scripts in step-by-step mode and to trace values of any variables and script output...
|
|
| Script Debugger IDE is full-featured client and server ActiveX Scripting debugger. It provides developers with a robust set of tools for developing scripts and Web applications. With Script Debugger IDE, developers can set breakpoints on both client- and server-side scripts, step through code, add "watch" variables, investigate the call stack, and debug remote Web servers. IDE has various power tools e.g. Object Browser to examine and discover objects, WMI Wizard to create WMI-based scripts, etc. Also Script Debugger IDE provides all functionality of Macros IDE with ability to debug macros... |
|
| SplineTech JavaScript Debugger is the independent standalone JavaScript Debugger that enables you to easily edit and debug JavaScript and client-side VBScript inside HTML, DHTML and AJAX pages...
|
|
| RQ Debugger IDE is programmer editor for Rapid-Q Basic and FreeBasic programming languages
Main features:
- multiwindow
You can open 32 files and switch to one using "Windows" menu item.
You can switch to last window (with saving cursor's position) using "LastW" menu item.
- named bookmarks
You can set 32 bookmarks in every window (opened file)
You can "Add", "Delete", "Set", "Sort" bookmarks.
You can switch to last bookmark using "LastBM" menu item.
- projects
You can save list of windows and bookmarks as Project.
When RQ Debugger IDE is running, it loads all Windows (and other settings) from last project.
It automatically open last Window and set cursor to saved position.
- step-by-step debugger for Rapid-Q basic
execute while value not equal..
execute to cursor
step-by-step execution
- objects treeView
- include files treeView
- syntax hilighting
- FreeBasic dll compilation
- sub list
- fileManager.. |
|
| SoftX HTTP Debugger is a full-scale tool for developers for viewing and analyzing all outgoing and incoming HTTP protocol traffic between a web browser, or any other Internet related program, and the Internet.
Each HTTP request and/or response can be examined to see the HTTP header parameter values, cookies, query strings and error codes etc. All captured network traffic can be saved either in a RAW network format or in a decoded (how browsers see it) format.
HTTP Debugger works with all today's alternative browsers and their plugins, as well as with your own software. You can even monitor and debug ICQ, MSN, Yahoo Messenger and other popular Internet programs.
* Monitor and debug all outgoing HTTP requests from a browser (or any other Internet related program) and the corresponding responses from a server.
* See the full HTTP header and HTTP content data of both: HTTP requests and responses.
* Catch when the browser performs automatic redirects.
* Capture requests from all of the installed plugins (Flash, ActiveX, etc,) in addition to requests sent by a browser directly.
* View all the captured images, HTML or XML code, etc in the built-in web control.
* Simultaneously analyze the same page in all popular browsers.
* Measure the size and downloading time of your web pages to optimize the performance of your web site.
* The gzip and chunked encodings will be automatically processed by the program.
* View information supplied by each web browser or any program when you visit a site.
* Analyze how other sites work and how they implement certain features.
* Learn about how HTTP works (useful for when programming and web designing).
Supports Internet Explorer 7 Protected Mode in Windows Vista...
|
|
| Select the best tool to process an unhandled application exception without modifying the Windows registry... |
|
 | SplineTech JavaScript HTML Debugger is a unique web development tool that enables you to easily edit and debug JavaScript and VBScript inside HTML pages. Client-Side JavaScript, JScript and VBScript debugging languages are fully supported for simple and complex HTML and DHTML debugging scenarios.Now Featuring dockable floating windows, and an intagrated interactive step by step javascript debugging guide. Latest feature added - Local variable Watch tree... |
|
| SplineTech VBS Debugger PRO is an award-winning VBS debug tool that enables you to easily edit and debug VBS files, debug VBS scripts and JS scripts. Native support for JavaScript, Jscript, VBScript and Windows Scripting Host (wscript)... |
|
 | Atrise PHP Script Debugger is an online debug script for your PHP projects. It can help you to show PHP variables, debug string output, script execution time, the page source and other information that helps you in your PHP development.. |
|
Related search : xpert debugger,debugger expert debuggerexpert debugger expertdebugger idescript debugger,ide script debuggerjavascript debugger,splinetech javascript debuggerdebugger idemenu item,http debuggersoftx http,softx http debuggerinternet related programhttOrder by Related
- New Release
- Rate
windows debugger -
analytic debugger -
expert debugger 3.1 -
javascript debugger -
realview debugger -
|
|